|
0 registered members (),
258
guests, and 3
spiders. |
|
Key:
Admin,
Global Mod,
Mod
|
|
|
Forums69
Topics113,633
Posts1,341,396
Members1,814
| |
Most Online731
Jan 14th, 2020
|
|
|
 Excel bell curve assistance
#1504223
Excel bell curve assistance
#1504223
22/08/2014 13:16
22/08/2014 13:16
|
Joined: Dec 2005
Posts: 17,917
JimO
 OP
OP
Forum veteran
|
OP
Forum veteran
Joined: Dec 2005
Posts: 17,917
|
I am trying to draw a bell curve of some data, but for the life of me can't get it to work.. Basically I have alist of employees and their salaries, and I need to plot them on a bell curve to display their distribution. In the first group I am looking at I have just 9 employyes, but I need to plot this for other groups, so the data could grow as much as 100 people in one group. I have the following data in place: stddev: 2.67 mean: £9.82 Min: £6.83 Max: £14.51 No of data points: 9 (£6.83, £7.60, £7.78, £7.78, £9.07, £9.13, £12.14, £13.51, £14.51) I have then worked out a data table, showing my distributions, but.... IT WON'T BLOODY WORK  Can anyone please assist? Thanks as ever y'all 
|
|
|
Re: Excel bell curve assistance
[Re: JimO]
#1504271
22/08/2014 17:59
22/08/2014 17:59
|
Joined: Dec 2005
Posts: 8,418
Lightwater, Surrey
DaveG
Club Treasurer Member 311
|
Club Treasurer Member 311
Je suis un Coupé
Joined: Dec 2005
Posts: 8,418
Lightwater, Surrey
|
With your 9 points, I get Std Dev = 2.833 using Excel?
Anyways, in cells A1:A9 I put your data values, in A11 I put MIN, A12 is MAX, A13 is =STDDEV(A1:A9) and A14 is =AVERAGE(A1:A9)
In B1 put =NORMDIST(A1, $A$14, $A$13, FALSE) and copy down to B2:B9
In C8 I put =A14 (the average, or mean)
In C7 I put =C8-1 and copy it up to C1:C6, similarly in C8 put =C7+1 and copy down to C9:C15
The copy B1 into cells D1:D15
Now highlight C1:D15 and on the ribbon click on Insert then click on Scatter and choose Scatter with Smooth Lines. This creates your "bell curve"
Then to show the actual data point, right click on the chart and choose Select Data... and then press Add. For X values you want A1:A9 and for Y values B1:B9 then press OK. You'll get a wonky line, but we'll fix that, so right click and select Format Data Series. For Line Color select No line, then close.
Select the chart again and then from the ribbon (Chart Tools) click on Layout and click on Error Bars then select More Error Bar options at the bottom. Click on Series 2, OK, then for Vertical Error Bars click on Minus and No Cap, select Percentage and enter 100. You'll now have some horizontal bars to get rid of, so right click on one of them and select Format Error Bars... and this time enter 0 in the fixed value box and press close.
You can now remove the legend, or fatten up the error bars, add labels or whatever you want to make it look pretty. Is that what you want Jim?
1996 Portofino 20vt & 2000 Pearl White Plus
1985½ & 2016 2017 Fiat 124 Spider + XF Sportbrake
|
|
|
Re: Excel bell curve assistance
[Re: JimO]
#1504306
22/08/2014 22:08
22/08/2014 22:08
|
Joined: Dec 2005
Posts: 17,917
JimO
OP
Forum veteran
|
OP
Forum veteran
Joined: Dec 2005
Posts: 17,917
|
I get close Dave, but I don't get the cigar  The curve just looks and is wrong! A late night tinkling the keys looms!
|
|
|
Re: Excel bell curve assistance
[Re: JimO]
#1504318
23/08/2014 00:03
23/08/2014 00:03
|
Joined: Jan 2006
Posts: 5,988
Sunny Darlo
Wishy
Forum is my life
|
Forum is my life
Joined: Jan 2006
Posts: 5,988
Sunny Darlo
|
I have one kicking around somewhere that I'll dig up tomorrow to see if it works with your data. Will be later on though as I have a date with a cement mixer during the day!
Up yours Photobucket.
|
|
|
Re: Excel bell curve assistance
[Re: JimO]
#1504333
23/08/2014 11:14
23/08/2014 11:14
|
Joined: Dec 2005
Posts: 8,418
Lightwater, Surrey
DaveG
Club Treasurer Member 311
|
Club Treasurer Member 311
Je suis un Coupé
Joined: Dec 2005
Posts: 8,418
Lightwater, Surrey
|
A bit more tricky in Excel 2013 (pull up Error Bars by clicking on the + to the right of the chart) but here's what I got 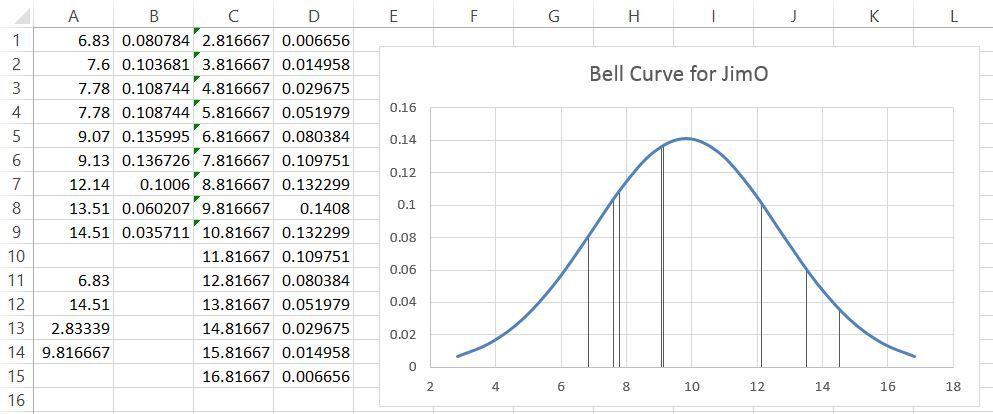 Maybe if you put up a sketch of what you want Jim, we can do it for you? (Apart from the stupidity fix  )
1996 Portofino 20vt & 2000 Pearl White Plus
1985½ & 2016 2017 Fiat 124 Spider + XF Sportbrake
|
|
|
Re: Excel bell curve assistance
[Re: JimO]
#1504340
23/08/2014 14:00
23/08/2014 14:00
|
Joined: Dec 2005
Posts: 17,917
JimO
OP
Forum veteran
|
OP
Forum veteran
Joined: Dec 2005
Posts: 17,917
|
Wishy, i'll swap your cement mixer for this any day of the week! So I think I may be asking and trying to build slighty the wrong thing then, as I do get the graph that Dave has shown, but thats not exactly what I need! Allow me to try and explain my needs! I think this is to do with percentiles, or at least in my mind it is! - The far left of the curve, the minimum should be £6.83, or a P0
- The far right of the curve, the maximum should be £14.51, or a P100
- The peak would be the average, or a P50.
The full list of distribution being:
0%	6.83
10%	7.44
25%	7.78
50%	9.07
60%	9.11
75%	12.14
90%	13.71
100%	14.51
Basically, I have told the client, min and max salaries, which were the P10 & P90 and the P50, and they have requested to see the distribution of the rest of the salaries within those points! Does that make sense, and is it possible in Excel?
|
|
|
Re: Excel bell curve assistance
[Re: JimO]
#1504358
23/08/2014 20:17
23/08/2014 20:17
|
Joined: Jan 2006
Posts: 5,988
Sunny Darlo
Wishy
Forum is my life
|
Forum is my life
Joined: Jan 2006
Posts: 5,988
Sunny Darlo
|
I've just dug out the one that I did a couple of years ago and the solution looks like it uses the same NORMDIST() formulae as Dave's above. I'll have a little play to see what it looks like anyway.
I won't be swapping the cement mixing for anything, that was fun that was.
Last edited by Wishy; 23/08/2014 21:22.
Up yours Photobucket.
|
|
|
Re: Excel bell curve assistance
[Re: Wishy]
#1504391
24/08/2014 00:01
24/08/2014 00:01
|
Joined: Jan 2006
Posts: 5,988
Sunny Darlo
Wishy
Forum is my life
|
Forum is my life
Joined: Jan 2006
Posts: 5,988
Sunny Darlo
|
This sort of thing but as Dave mentions above, a picture (of what you're expecting) is worth a thousand words. The red line on mine is going to be the same as DaveG's as it uses the same base formula, NORMDIST().  One thing I'm thinking, looking at the type of data, is that a gamma distribution (Excel has a function for this GAMMADIST() ) is going to be more suitable than a standard bell curve (which I'm interpreting as a normal distribution).
Last edited by Wishy; 24/08/2014 00:03.
Up yours Photobucket.
|
|
|
|